Addiction Treatment Case Study – Florida Rehab Center Providing Detox / Rehab / Sober Living
CLIENT: Addiction Treatment – Detox, IOP & PHP Rehabilitation and Sober Living
INDUSTRY: Healthcare/Addiction Recovery
CAMPAIGN : Website Design and Migration, SEO, Website Maintenance, Social Media, Conversion Rate Optimization
STRATEGY: Deploy best-practice Digital Marketing across the site and around the web to increase interest in their detoxification, residential, and sober living services with a heavy focus on SEO and Conversion Rate Optimization.
Background & Goals
The client in this case study came to us with six main goals:
Strategy & Execution
We’ve been working with this client on over a dozen of their sites for several years but about two years ago, the decision was made to eliminate the primary site and focus on their branded domain which at the time didn’t have any SEO applied to it. When we originally started the project, their primary site at the time was averaging about 40-100 visitors per day from organic referrals, but the conversion rates didn’t quite add up when looking at the traffic volume the site was getting on a daily average.
A thorough audit of their Google Analytics and Google Webmaster Tools (now Google Search Console) told the tale. As the Lead to Recovery (LTR) team began to dig into the content of the site while also evaluating their link portfolio, it became evident the client’s primary site was in desperate need of an overhaul. Not only did their primary site have a ton of worthless content that artificially inflated organic traffic volume for irrelevant phrases in most cases, but their backlink portfolio was riddled with dozens upon dozens of exact phrase anchor text iterations that no doubt was causing issues at Google. A deep cleansing was needed.
Our first priority was to clean up their backlinks to mitigate Google Penguin penalties that caused the site not to rank as efficiently as it could. This process took some time to accomplish; roughly 2-3 months coupled with ongoing monitoring throughout our engagement. Once the links were cleaned up and we continued to gain new, highly relevant inbound links to the site, we then moved on to content consolidation and content creation.
Keyword research and relevance is everything in SEO, so it only made sense to look at high traffic and relevant terms to determine fresh article angles that not only increased the organic traffic to our client’s site but more importantly, increased the number of quality leads being generated by the digital marketing campaign.
Results
Within the first year, traffic nearly doubled and the conversion rates followed. The following year showed similar growth as well. Fast forward to 2015, the decision was made to shift focus away from their primary site and only focus our Digital Marketing efforts on their branded domain. Looking at the statistics from when we started to work on the branded domain in early 2015 and compare year-over-year data for 2016 vs. 2015, the results show clear and significant growth in Google Organic: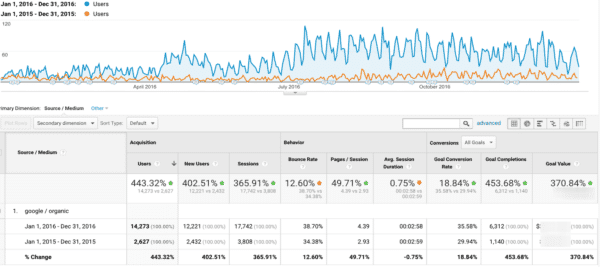
2016 vs. 2015 YoY Statistics showed:
In the first year of the campaign, the client realized a solid growth trajectory for the branded domain and as one can tell from the statistics above, this growth didn’t only apply to organic traffic, but to bottom line conversions which is what it’s all about when it comes to marketing.
Each month, our team of experts conducted exhaustive A/B and multivariate testing methods on the site to source ways to increase conversion rates for key pages that showed the most potential for conversion based on each page’s traffic volume, its content and anticipated user intent to convert. Conversion Rate Optimization (CRO) isn’t a one and done scenario. CRO needs to be a sustained initiative to always challenge existing page structure, content, etc. to amplify conversion rates which is what we did here and continued to do throughout our engagement.
Moving into 2017, the growth continued. For 2017 vs. 2016, here’s what Google Analytics shows us YoY for Google Organic:
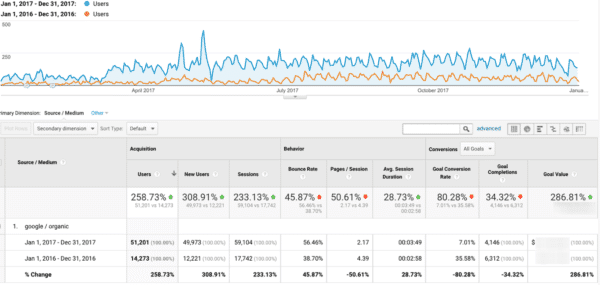
2017 vs. 2016 YoY Statistics showed:
Individual Goals
For this client, their three top converting goals consisted of A) short form/contact us form submissions, B) insurance form submissions and C) inbound phone calls followed by live chat engagements which typically impacted all three of these goals.
Let’s look at the top three conversion points individually.
Goal A. Short Form & Contact Us Form Submissions
Since the client has several goals for tracking and quantifying ROI, here’s how things look at a more granular level starting with short form submissions for the same time period (2017 vs. 2016):
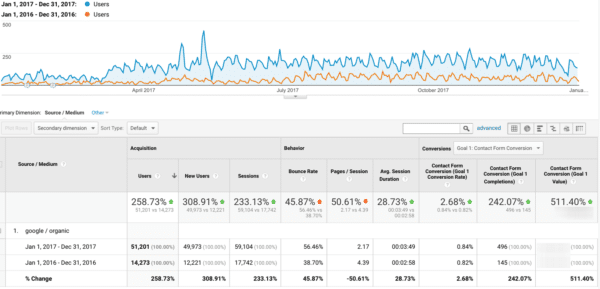
Short Form & Contact Us Form Statistics Showed:
Goal B. Insurance Form Submissions:
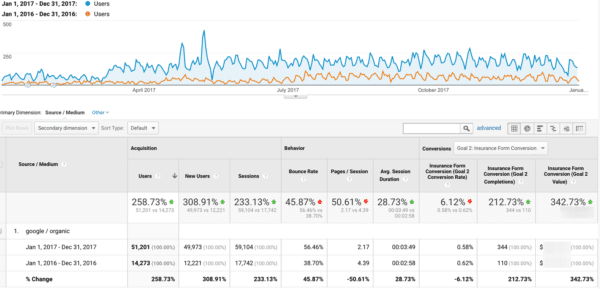
Insurance Form Statistics Showed:
Goal C. Inbound Phone Calls:
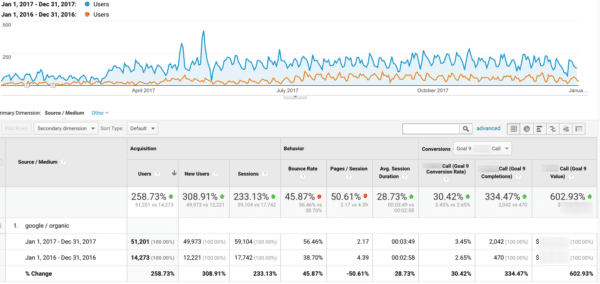
Inbound Phone Call Statistics Showed:
Overall Statistics Showed for Top 3 Goals – 2017 vs. 2016:
Moving into 2018, the growth continued to gain even more momentum…
For 2018 (Jan.1-Oct.1) vs. 2017 (Jan.1-Oct.1), here’s what analytics shows for Google Organic:
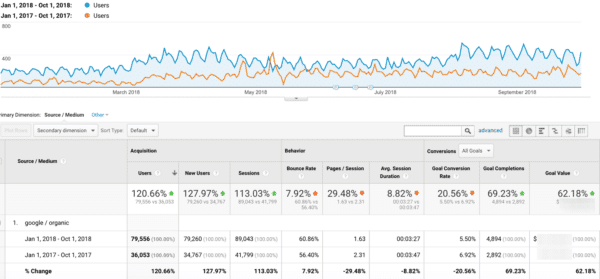
2018 (Jan.1-Oct.1) vs. 2017 (Jan.1-Oct.1) Statistics Showed:
Individual Goals – 2018 (Jan.1-Oct.1) vs. 2017 (Jan.1-Oct.1)
Goal A. Short Form & Contact Us Form Submissions
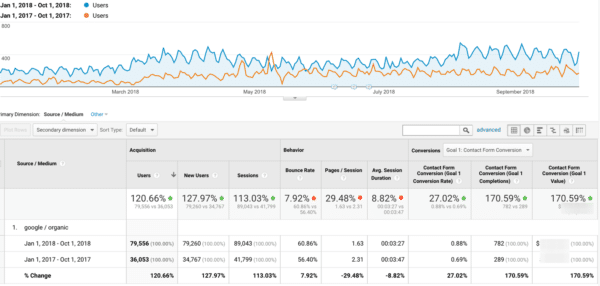
Short Form & Contact Us Form Statistics Showed:
Goal B. Insurance Form Submissions:
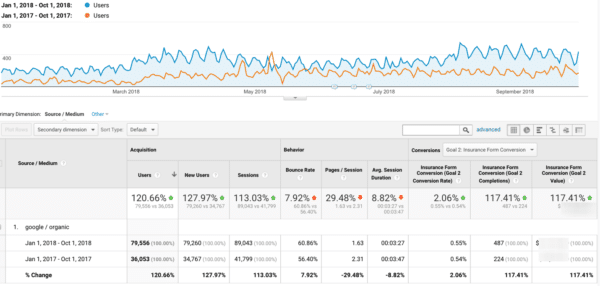
Insurance Form Statistics Showed:
Goal C. Inbound Phone Calls:
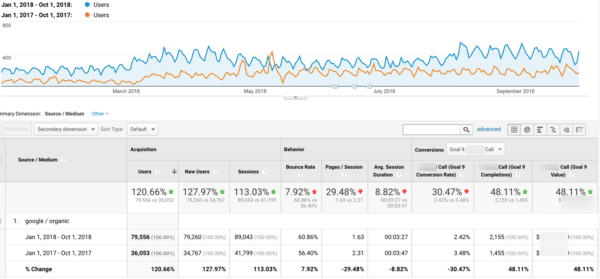
Inbound Phone Calls Showed:
2016 – October 1, 2018:
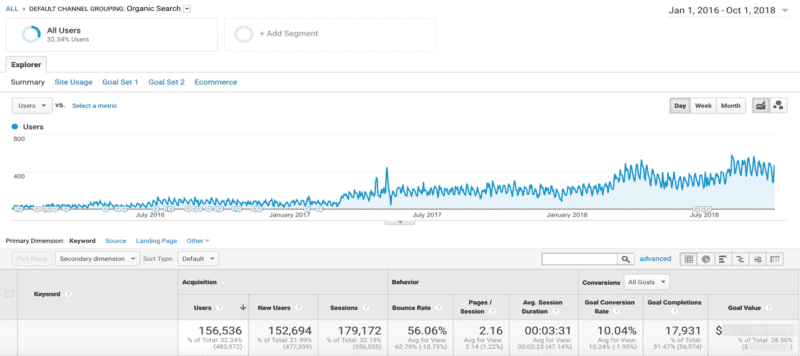
In the most recent months as we neared the end of our engagement, this client went from sparse acquisition of just a handful of patients each month (2-5/month) at the beginning of our campaign to a monthly average of 20+ new patients each month from organic traffic alone. This equated to well over $500k/month in realized revenue.
“My experience working with LTR from strategy creation to execution has been great. They really helped me understand where they wanted to take us and have been very good about communicating as we moved through the process. We have been impressed at how well they understand our business and how it’s different from our competitors and how they’ve created a unique strategy for us. I would recommend LTR to anyone. Our experience has been that they truly care about our business and they want to see it succeed. They’ll do everything they can to make sure that happens.”
Digital Expertise for Addiction Treatment Centers
If you’re going to spend money marketing your rehab center, detox center or sober living accommodations, make sure your marketing dollars are being allocated to the right tactics, message, and audience.
We know this space and know how to achieve verifiable ROI for businesses like yours. If you’re not convinced your site is performing at the levels it should, don’t waste another minute. Contact Lead to Recovery to see how we can help optimize your marketing spend for the long term.
We are ready to help you begin.
Email us at [email protected]
